


Blog

Article
What most AI agents get wrong about field selling

Article
Agentic B2B SaaS: From rigid workflows to manageable mass customization

Article
Showpad vs. Seismic: Which sales enablement platform is best for field sales teams?

Article
Salesforce Headless 360 and Showpad: What the agent shift means for field-selling teams

Article
Why legacy sales enablement is no longer enough for modern field teams

Article
What are safe, trusted AI tools for enterprise sales and marketing teams?

Press Release
Showpad defines the AI-native revenue effectiveness category with first end-to-end platform for field sales organizations

Article
For teams who sell what the world relies on, you can rely on the new Showpad
Article
Revenue effectiveness starts here: Showpad Spring Release 2026

Article
The AI sales simulator that ensures sellers are ready for anything: Roleplay AI

Article
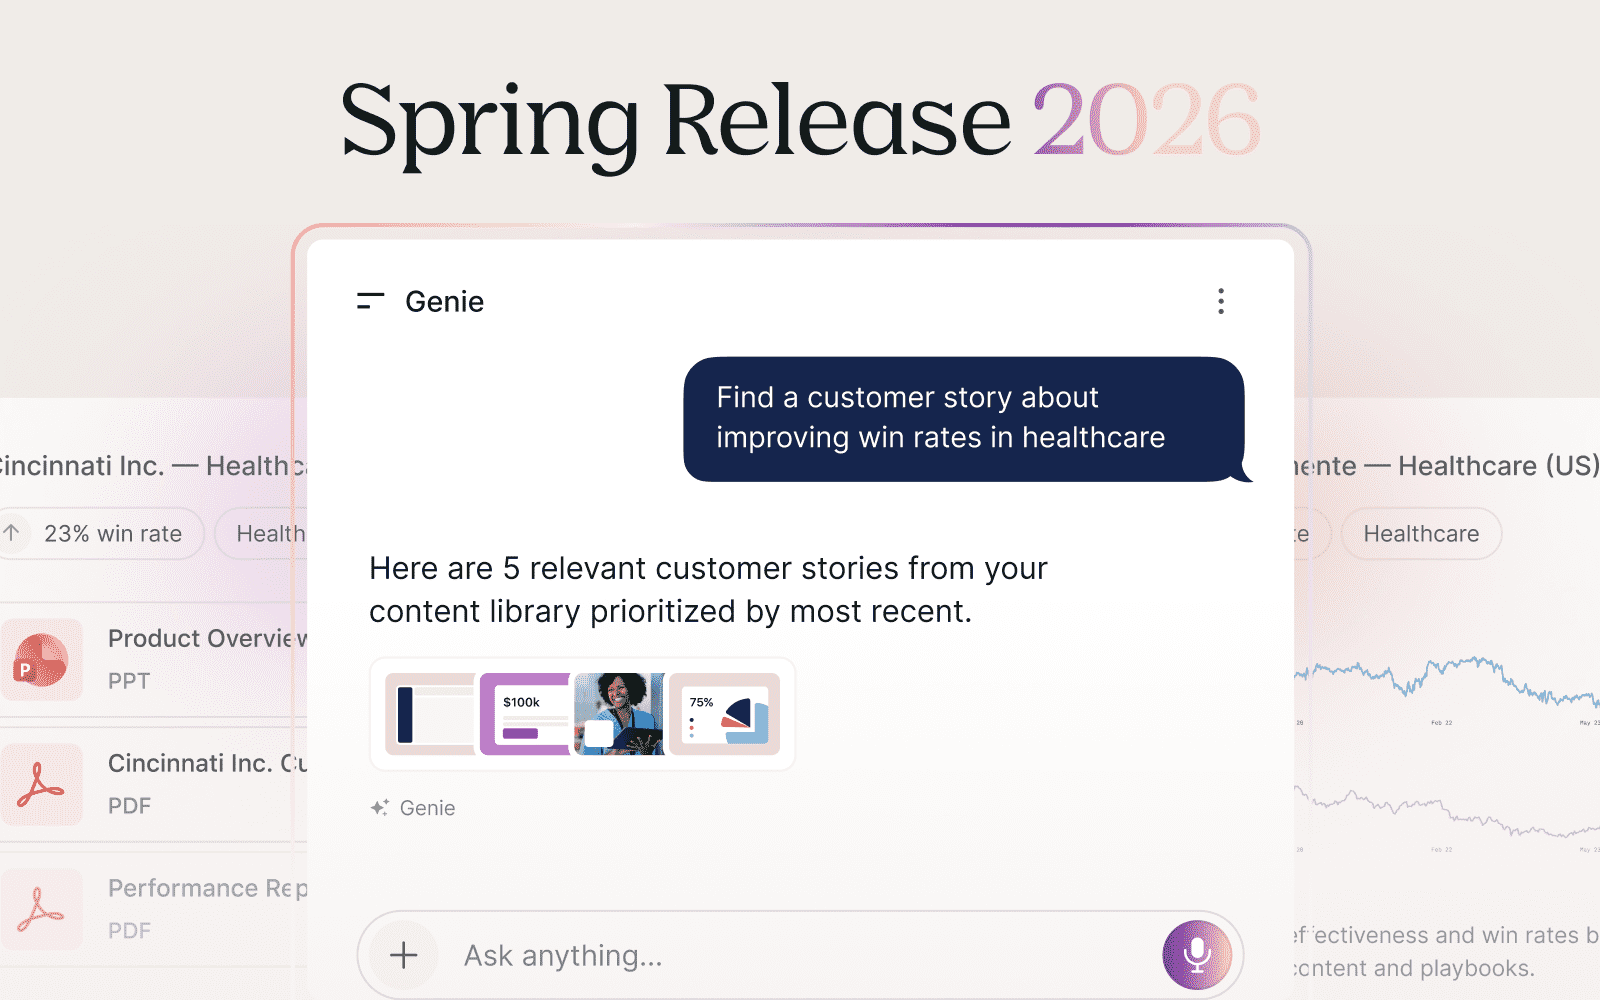
How Genie Assistant deep research delivers intelligence to revenue teams

Article
Most AI is built for a seller who’s not in your organization