


Analytics & Insights
Connect action to achievement.
Draw a straight line from content usage to closed deals and onboarding to quota attainment, making it clear to leadership the impact marketing and enablement delivers.

Fueling data-backed decisions at 2,000+ global companies
Know what works.
Scale what wins.

Turn data into decisions, not just dashboards.
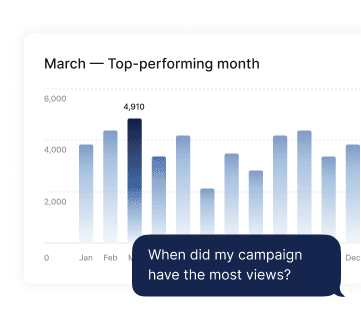
Ask Analytics AI what you need to know in plain language and get specific answers about what's working, what's not, and what to do next.
Craft the custom reports your leaders need to make the right moves.
Blend Showpad insights with CRM and BI data to prove end‑to‑end ROI, and build the views leaders need to see what wins, fix what doesn’t, and fund winning strategies.
One platform that gives you the whole picture.
Integrated analytics across sales readiness, content management, and buyer engagement to spot patterns faster, act with confidence, and prove effectiveness across individuals, teams and regions.
AI that turns insights into actions.
Transform scattered engagement and enablement performance data into clear, real‑time guidance with AI recommendations for next steps. Reliability for leaders to act on. Power to prove ROI to your board.

Don’t just log the past. Inspire the future.
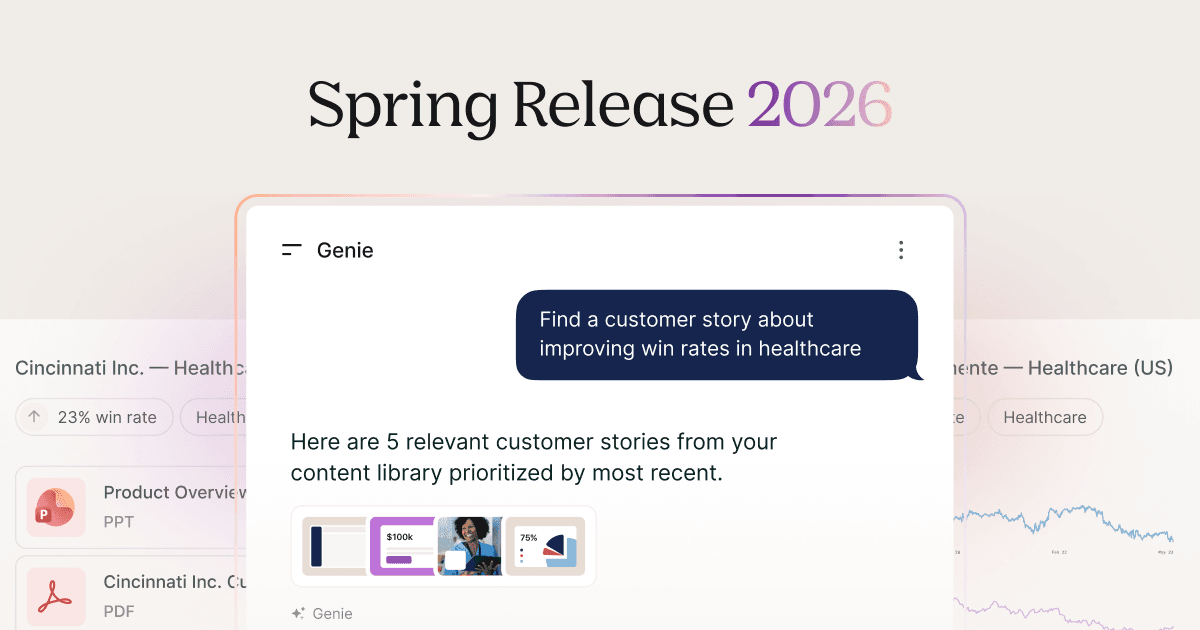


Content that’s proven in the close.
- Analytics AI to ask follow‑up data questions in plain language and dig deeper into insights

- Question-based analytics gives focused answers to enablement performance questions
- Report Builder personalizes the intel important for decision-making
Know what impact content usage and buyer engagement have on sales results, spot zero‑impact materials fast, and double down on the formats and topics buyers value.

Frameworks that scale your strongest plays.
See which collateral your top performers use, which skills they’ve mastered, and what they do differently in deals — then build enablement programs that teach everyone else those same tactics.
- Competencies track rep and team-level progress
- Workflow insights to trace A-player behaviors
- KPI-connected reporting to link training and coaching to sales goals

Actions based on what buyers care about.
Was it the cut sheet, pricing comparison, or case study? Know exactly what prospects read and when they’re engaged, so sellers show up prepared with what’s working and what to say next.
- Real-time engagement notifications to know when buyers are active
- Asset-level metrics for monitoring what catches buyer interest
- Meeting insights help you document buyer conversations
Proof from the field.


Just Eat increased post-meeting actions by 40% with custom data dashboards
The infrastructure for reliable revenue.
Bring Showpad analytics together with your CRM and BI tools to reveal clear, complete views of what gets results so leaders can architect, scale, and nurture repeatable patterns of success.

Discover what’s possible with the complete platform.


Frequently asked questions
Showpad uses a layered, action-first approach. Question-based analytics surface the answers to essential performance questions up front, Analytics AI lets you ask follow‑ups in plain language, and admin dashboards consolidate priority metrics across sales readiness, content management, and buyer engagement.
Yes. You can understand the ROI of your sales materials by seeing which assets and training are used, how buyers engage with them, and where those materials influence deals. Additionally, integrations with your CRM allow you to connect content and learning programs to win rates, sales cycle length, and rep ramp time.
Our Report Builder feature enables custom analyses inside Showpad, while integrations make it easy to compare performance across teams and territories and present impact in the systems your leaders already use, like Power BI.